> ## Documentation Index
> Fetch the complete documentation index at: https://docs.norafleet.ai/llms.txt
> Use this file to discover all available pages before exploring further.
# Logging
# Logging
> Search, export, and keep a history of every agent's logs — with configurable storage, retention, and deletion controls.
Nora saves every running agent's container output (stdout/stderr — startup output, crashes, stack traces, OOM kills) so you can search and export it later, even after the agent has restarted or the live log viewer is closed. OpenClaw agents also send structured gateway logs. Logs are compressed, encrypted, and stored in the destination you configure.
Log collection is on by default after setup — there's nothing to configure before you can use it.
## View an agent's logs
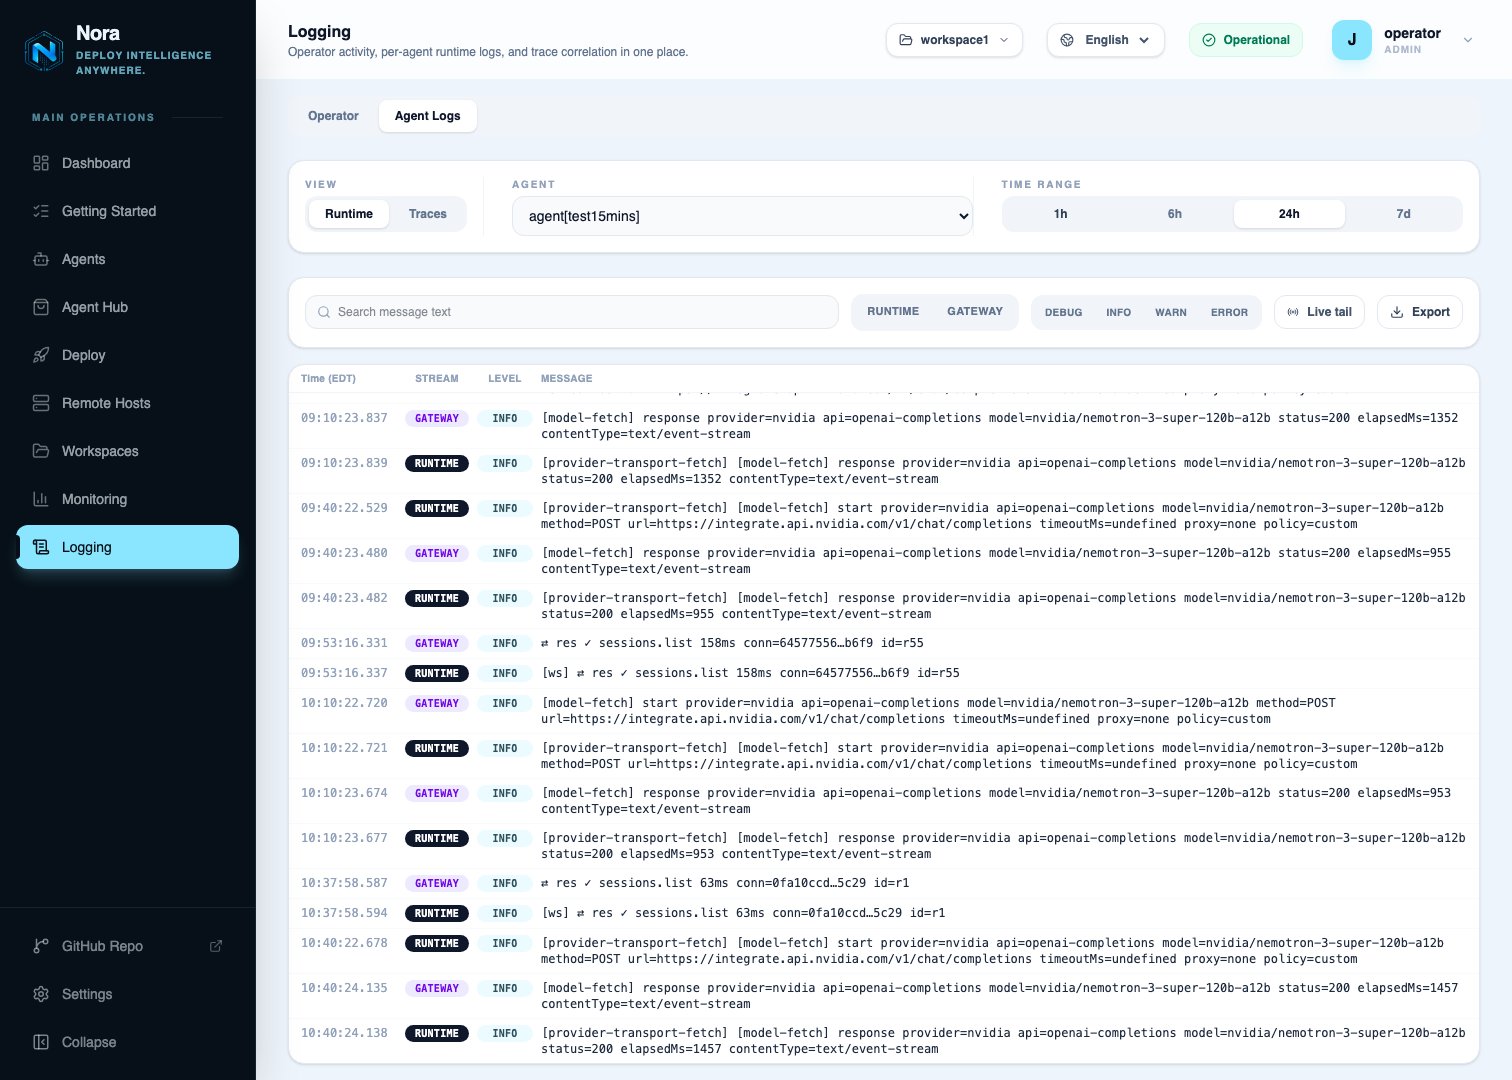 Click **Logging** in the dashboard sidebar and switch to the **Agent Logs** tab. (The
**Operator** tab is your account's activity log — see
[Monitoring](/guides/monitoring#activity-events).)
Keep the **Runtime** view, choose the agent, and choose a time range: **1h**, **6h**, **24h**,
or **7d**.
Search the message text, and narrow by stream or level (**Debug**, **Info**, **Warn**,
**Error**). Turn on **Live tail** to follow new lines as they arrive.
Click **Export** to download the lines matching your current filters and time range as an
NDJSON file.
Each line shows its time, stream, level, and message. There are two streams:
| Stream | What it contains | Available for |
| - | - | - |
| **Runtime** | The agent container's raw output (stdout/stderr) | Every agent |
| **Gateway** | Structured logs from the OpenClaw gateway — model calls, tool calls, sessions | OpenClaw and NemoClaw |
New lines show up in search right away. They're written to storage in batches about every 15 minutes.
For a quick look at what an agent is printing right now, the **Logs** tab on the agent's own page
shows a live stream — see [Access chat, logs, and terminal](/guides/deploy-agent#access-chat-logs-and-terminal).
Use the **Logging** page when you need history, search, or export.
## What's supported
| Runtime family | Container logs | Gateway logs | Traces |
| - | - | - | - |
| OpenClaw | ✓ | ✓ | Not yet¹ |
| NemoClaw (sandbox profile) | ✓ | ✓ | Not yet¹ |
| Hermes | ✓ | — | — |
¹ Tracing needs a newer OpenClaw than Nora currently deploys — see [Traces](#traces).
Container logs work on Docker, Kubernetes, and Remote Docker (an experimental deploy target). Kubernetes requires `s3` or `r2` storage — see [Storage destinations](#storage-destinations).
**Proxmox LXC logging is best effort**, like Proxmox support in general (see
[Proxmox](/configuration/provisioner-backends/proxmox)). Logs are collected, but after a
reconnect or worker restart some lines may be stored twice or missed, and each line is timestamped
when Nora receives it rather than when the agent wrote it.
## Delete logs
Logs are deleted automatically when they pass the [retention period](#retention). You can also delete them yourself.
### Delete a time range
To free up space, delete one agent's logs for a time range. This is available through the API only — there's no button for it in the dashboard:
```http theme={null} theme={null}
DELETE /api/logs
{ "agentId": "", "from": "2026-08-01T00:00:00Z", "to": "2026-08-31T00:00:00Z" }
```
### When you delete an agent or workspace
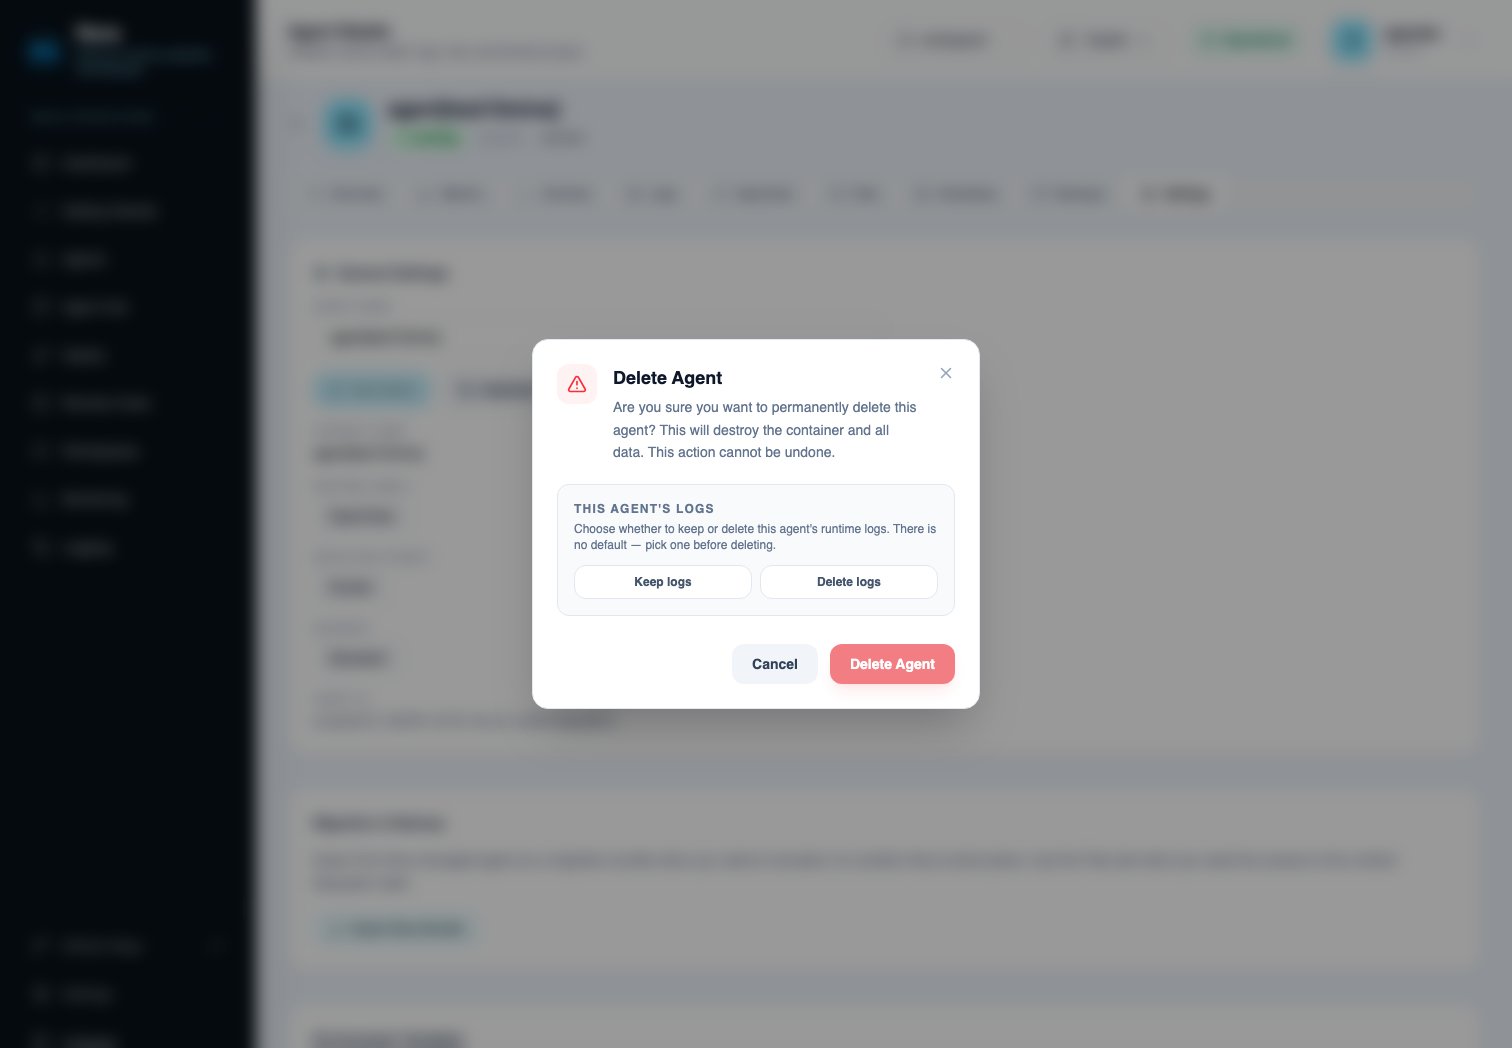
Deleting an agent (from its **Settings** tab) or a workspace asks whether to **Keep logs** or **Delete logs**. There's no default — you have to pick one.
Click **Logging** in the dashboard sidebar and switch to the **Agent Logs** tab. (The
**Operator** tab is your account's activity log — see
[Monitoring](/guides/monitoring#activity-events).)
Keep the **Runtime** view, choose the agent, and choose a time range: **1h**, **6h**, **24h**,
or **7d**.
Search the message text, and narrow by stream or level (**Debug**, **Info**, **Warn**,
**Error**). Turn on **Live tail** to follow new lines as they arrive.
Click **Export** to download the lines matching your current filters and time range as an
NDJSON file.
Each line shows its time, stream, level, and message. There are two streams:
| Stream | What it contains | Available for |
| - | - | - |
| **Runtime** | The agent container's raw output (stdout/stderr) | Every agent |
| **Gateway** | Structured logs from the OpenClaw gateway — model calls, tool calls, sessions | OpenClaw and NemoClaw |
New lines show up in search right away. They're written to storage in batches about every 15 minutes.
For a quick look at what an agent is printing right now, the **Logs** tab on the agent's own page
shows a live stream — see [Access chat, logs, and terminal](/guides/deploy-agent#access-chat-logs-and-terminal).
Use the **Logging** page when you need history, search, or export.
## What's supported
| Runtime family | Container logs | Gateway logs | Traces |
| - | - | - | - |
| OpenClaw | ✓ | ✓ | Not yet¹ |
| NemoClaw (sandbox profile) | ✓ | ✓ | Not yet¹ |
| Hermes | ✓ | — | — |
¹ Tracing needs a newer OpenClaw than Nora currently deploys — see [Traces](#traces).
Container logs work on Docker, Kubernetes, and Remote Docker (an experimental deploy target). Kubernetes requires `s3` or `r2` storage — see [Storage destinations](#storage-destinations).
**Proxmox LXC logging is best effort**, like Proxmox support in general (see
[Proxmox](/configuration/provisioner-backends/proxmox)). Logs are collected, but after a
reconnect or worker restart some lines may be stored twice or missed, and each line is timestamped
when Nora receives it rather than when the agent wrote it.
## Delete logs
Logs are deleted automatically when they pass the [retention period](#retention). You can also delete them yourself.
### Delete a time range
To free up space, delete one agent's logs for a time range. This is available through the API only — there's no button for it in the dashboard:
```http theme={null} theme={null}
DELETE /api/logs
{ "agentId": "", "from": "2026-08-01T00:00:00Z", "to": "2026-08-31T00:00:00Z" }
```
### When you delete an agent or workspace
Deleting an agent (from its **Settings** tab) or a workspace asks whether to **Keep logs** or **Delete logs**. There's no default — you have to pick one.
 Through the API, the `deleteLogs` field is required:
```http theme={null} theme={null}
DELETE /api/agents/:id
{ "deleteLogs": false }
```
### Recover kept logs
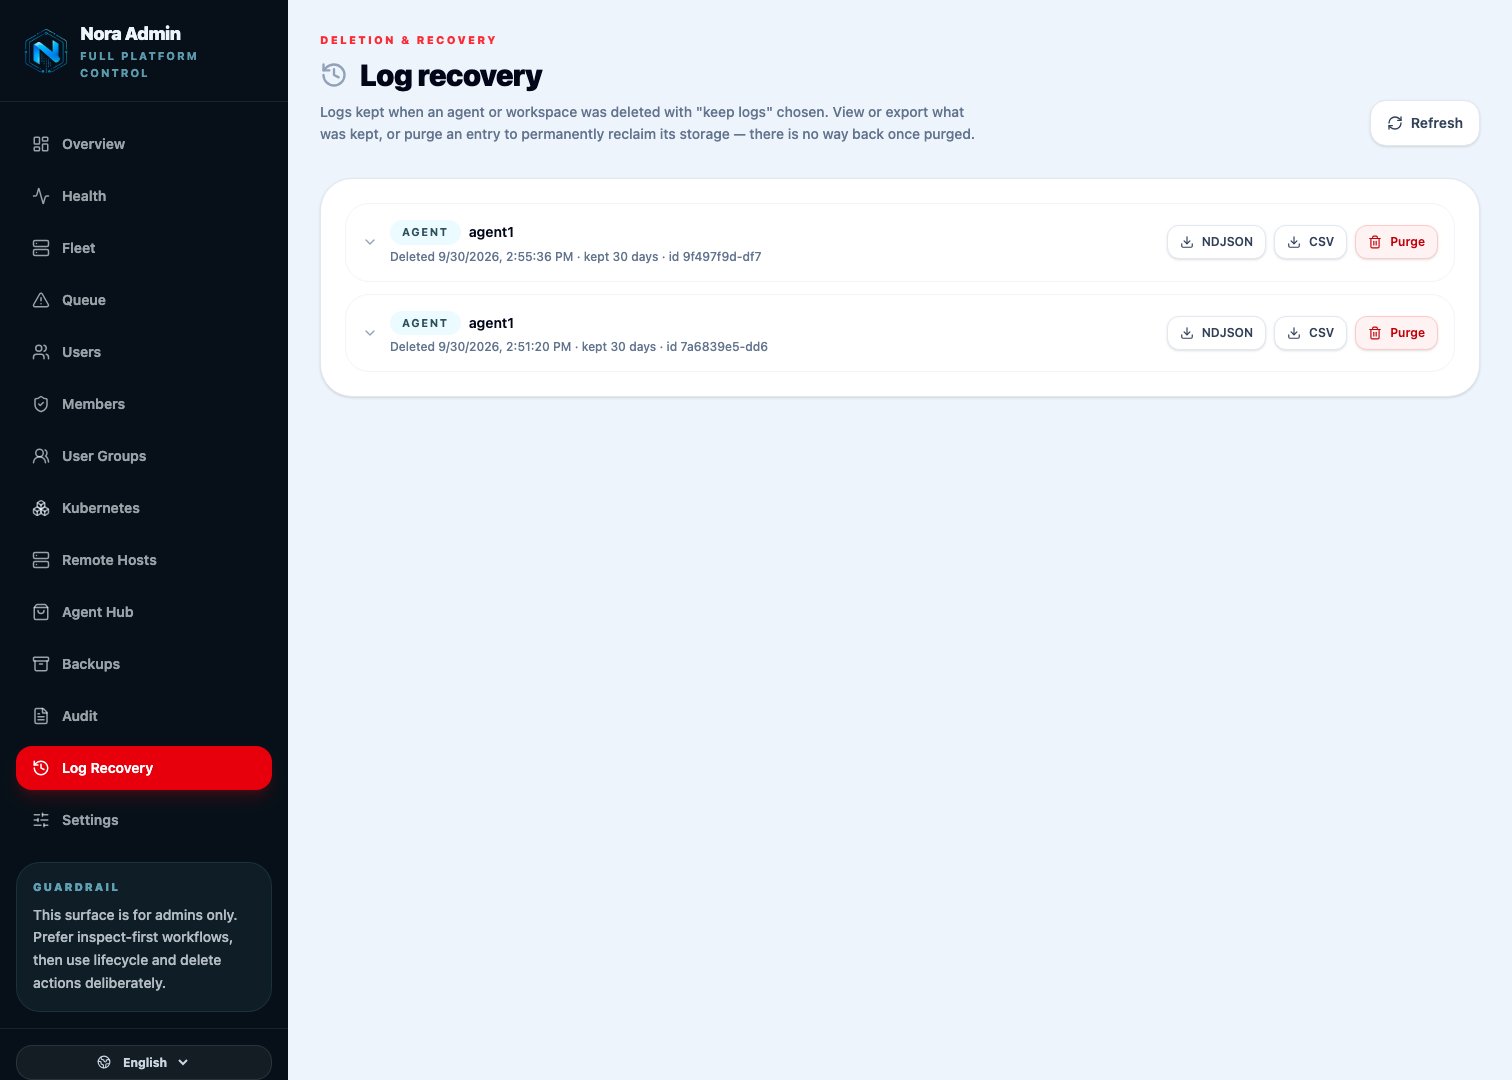
Kept logs no longer appear on the Logging page. Platform admins can find them on the **Log Recovery** page in the admin dashboard (`/admin/log-recovery`). Expand an entry to preview it, download it as **NDJSON** or **CSV**, or **Purge** it to free the space. Kept logs still expire on the retention period that applied when the agent was deleted.
Through the API, the `deleteLogs` field is required:
```http theme={null} theme={null}
DELETE /api/agents/:id
{ "deleteLogs": false }
```
### Recover kept logs
Kept logs no longer appear on the Logging page. Platform admins can find them on the **Log Recovery** page in the admin dashboard (`/admin/log-recovery`). Expand an entry to preview it, download it as **NDJSON** or **CSV**, or **Purge** it to free the space. Kept logs still expire on the retention period that applied when the agent was deleted.
 ## Permissions
| Capability | Who can do it |
| - | - |
| View, search, and export an agent's logs | Anyone with access to the agent; platform admins for any agent |
| Delete an agent's logs for a time range | Workspace editor or above |
| Change a workspace's log retention | Workspace admin |
| Delete a workspace (and keep or delete logs) | Workspace owner |
| Change the storage destination | Platform admin |
| View, export, or purge kept logs | Platform admin |
API keys need the `logs:read` scope to search and export, and only reach agents in the workspace the key belongs to.
## Turn log collection on or off
The rest of this guide covers setup and is mostly for platform admins.
Collecting logs means Nora stores what your agents print, so it's **off until you turn it on**. Nothing is collected after an upgrade unless someone chooses it.
* **Fresh install:** `setup.sh` / `setup.ps1` ask whether to enable log collection, how many days to keep logs, and how much disk the `local` destination may use.
* **Upgrade with `setup.sh --update` or `setup.ps1`:** it asks the same three questions once, on a terminal, if no choice has been made yet. Pressing Enter means no.
* **One-click upgrade from the dashboard:** it can't ask, so collection stays off. A banner in the admin dashboard says so until someone decides.
Platform admins turn collection on or off in **Settings → Log Collection** in the admin dashboard. It takes effect within about ten seconds, with no restart. It can also be set in `.env` (`NORA_LOG_ENABLED=true` or `false`, then restart `worker-provisioner`); once someone changes it in the dashboard, the dashboard setting wins and `.env` is ignored.
Turning collection on is refused if logs couldn't be saved (an unusable `NORA_LOG_ENCRYPTION_KEY`), or if you use local storage while Kubernetes is an enabled deploy target — pick S3, R2 or SSH storage first.
### When you turn collection off
If logs have already been collected, you're asked what to do with them. There's no default:
* **Keep existing logs** — they stay searchable and expire on the normal retention schedule.
* **Delete all logs** — every agent's collected logs are removed permanently, in the background. This can't be undone, and backups don't contain them. Logs kept for agents or workspaces you already deleted aren't touched; they have their own purge on the **Log Recovery** page.
Through the API, `PUT /api/admin/log-collection` takes `{ "enabled": false, "deleteExisting": true | false }`, and `deleteExisting` is required when logs exist. You can't turn collection back on while a delete is still running.
Collection is a platform-wide setting: it's on or off for every agent, and covers both container and gateway logs. Workspaces can't switch it off — they only choose how long their logs are kept (see [Retention](#retention)).
`NORA_LOG_ENCRYPTION_KEY` must be set for logs to be saved. Setup and upgrades generate it for
you. **Keep a copy of it with your `.env` backup, off the server** — without it, stored logs
can't be decrypted, even if they're in S3, R2, or SSH storage.
## Storage destinations
`NORA_LOG_STORAGE` selects where logs go. It's the same set of destinations as [managed backups](/guides/backups):
| Destination | Configuration |
| - | - |
| `local` | Default. Logs live in the `nora_logs` Docker volume. Not supported on Kubernetes. |
| `s3` | AWS S3 or any S3-compatible service (MinIO, Backblaze B2, Wasabi, etc.). Set `NORA_LOG_S3_*`. |
| `r2` | Cloudflare R2. Set `NORA_LOG_R2_*`. |
| `ssh` | SSH/SFTP upload to a remote host. Set `NORA_LOG_SSH_*`. Not yet tested for logs. |
See the [environment variable reference](/configuration/environment-variables) for the full list.
Logs are stored under a `logs/` folder, so you can safely point logs and backups at the same bucket or SSH path.
**`local` logs are not included in Nora backups.** If you lose the server, run
`docker compose down -v`, or restore a backup onto a new server, `local` logs are gone. Use `s3`,
`r2`, or `ssh` if logs need to survive losing the host.
**Kubernetes installs must use object storage (`s3` or `r2`).** The Helm chart refuses to install
with the `local` destination, and Nora rejects switching to `local` while Kubernetes is enabled.
The chart also requires a single `worker-provisioner` replica.
### Change the destination
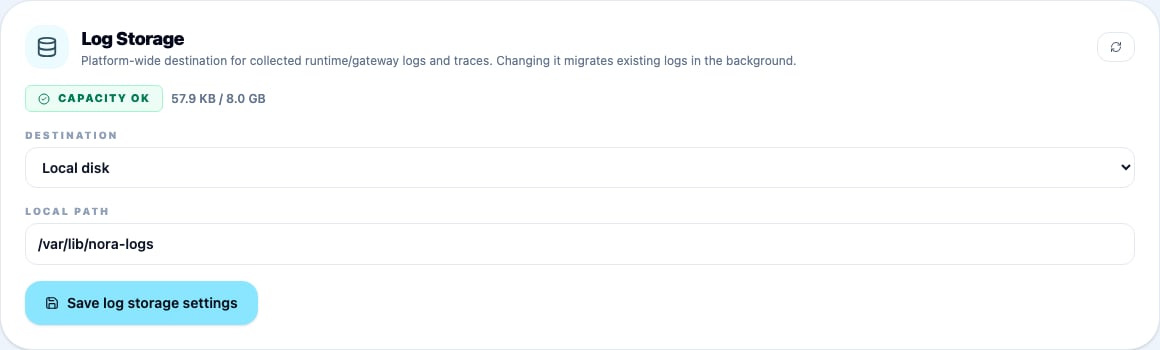
The env values only set the **initial** destination. After that, platform admins change it in the admin dashboard under **Settings → Log Storage**.
## Permissions
| Capability | Who can do it |
| - | - |
| View, search, and export an agent's logs | Anyone with access to the agent; platform admins for any agent |
| Delete an agent's logs for a time range | Workspace editor or above |
| Change a workspace's log retention | Workspace admin |
| Delete a workspace (and keep or delete logs) | Workspace owner |
| Change the storage destination | Platform admin |
| View, export, or purge kept logs | Platform admin |
API keys need the `logs:read` scope to search and export, and only reach agents in the workspace the key belongs to.
## Turn log collection on or off
The rest of this guide covers setup and is mostly for platform admins.
Collecting logs means Nora stores what your agents print, so it's **off until you turn it on**. Nothing is collected after an upgrade unless someone chooses it.
* **Fresh install:** `setup.sh` / `setup.ps1` ask whether to enable log collection, how many days to keep logs, and how much disk the `local` destination may use.
* **Upgrade with `setup.sh --update` or `setup.ps1`:** it asks the same three questions once, on a terminal, if no choice has been made yet. Pressing Enter means no.
* **One-click upgrade from the dashboard:** it can't ask, so collection stays off. A banner in the admin dashboard says so until someone decides.
Platform admins turn collection on or off in **Settings → Log Collection** in the admin dashboard. It takes effect within about ten seconds, with no restart. It can also be set in `.env` (`NORA_LOG_ENABLED=true` or `false`, then restart `worker-provisioner`); once someone changes it in the dashboard, the dashboard setting wins and `.env` is ignored.
Turning collection on is refused if logs couldn't be saved (an unusable `NORA_LOG_ENCRYPTION_KEY`), or if you use local storage while Kubernetes is an enabled deploy target — pick S3, R2 or SSH storage first.
### When you turn collection off
If logs have already been collected, you're asked what to do with them. There's no default:
* **Keep existing logs** — they stay searchable and expire on the normal retention schedule.
* **Delete all logs** — every agent's collected logs are removed permanently, in the background. This can't be undone, and backups don't contain them. Logs kept for agents or workspaces you already deleted aren't touched; they have their own purge on the **Log Recovery** page.
Through the API, `PUT /api/admin/log-collection` takes `{ "enabled": false, "deleteExisting": true | false }`, and `deleteExisting` is required when logs exist. You can't turn collection back on while a delete is still running.
Collection is a platform-wide setting: it's on or off for every agent, and covers both container and gateway logs. Workspaces can't switch it off — they only choose how long their logs are kept (see [Retention](#retention)).
`NORA_LOG_ENCRYPTION_KEY` must be set for logs to be saved. Setup and upgrades generate it for
you. **Keep a copy of it with your `.env` backup, off the server** — without it, stored logs
can't be decrypted, even if they're in S3, R2, or SSH storage.
## Storage destinations
`NORA_LOG_STORAGE` selects where logs go. It's the same set of destinations as [managed backups](/guides/backups):
| Destination | Configuration |
| - | - |
| `local` | Default. Logs live in the `nora_logs` Docker volume. Not supported on Kubernetes. |
| `s3` | AWS S3 or any S3-compatible service (MinIO, Backblaze B2, Wasabi, etc.). Set `NORA_LOG_S3_*`. |
| `r2` | Cloudflare R2. Set `NORA_LOG_R2_*`. |
| `ssh` | SSH/SFTP upload to a remote host. Set `NORA_LOG_SSH_*`. Not yet tested for logs. |
See the [environment variable reference](/configuration/environment-variables) for the full list.
Logs are stored under a `logs/` folder, so you can safely point logs and backups at the same bucket or SSH path.
**`local` logs are not included in Nora backups.** If you lose the server, run
`docker compose down -v`, or restore a backup onto a new server, `local` logs are gone. Use `s3`,
`r2`, or `ssh` if logs need to survive losing the host.
**Kubernetes installs must use object storage (`s3` or `r2`).** The Helm chart refuses to install
with the `local` destination, and Nora rejects switching to `local` while Kubernetes is enabled.
The chart also requires a single `worker-provisioner` replica.
### Change the destination
The env values only set the **initial** destination. After that, platform admins change it in the admin dashboard under **Settings → Log Storage**.
 Or through the API:
```http theme={null} theme={null}
PUT /api/admin/log-storage
{
"storageBackend": "s3",
"s3Bucket": "nora-logs-prod",
"s3Region": "us-east-1",
"s3AccessKeyId": "...",
"s3SecretAccessKey": "...",
"keepSourceCopies": true
}
```
New logs go to the new destination right away. When you switch to a different type of destination (for example `local` to `s3`), existing logs are copied over in the background — check progress with `GET /api/admin/log-storage/migration`. Only one migration can run at a time.
`keepSourceCopies` decides what happens to the old copies:
* **`false`** — old copies are deleted once they've been copied over.
* **`true`** — old copies are kept until they expire under normal retention. Keep the old destination's credentials configured until then.
## Retention
Logs and traces are deleted automatically once they're older than the retention period.
| Setting | Default | Where to change it |
| - | - | - |
| `NORA_LOG_RETENTION_CEILING_DAYS` | `30` | `.env`, then restart `backend-api` and `worker-provisioner` |
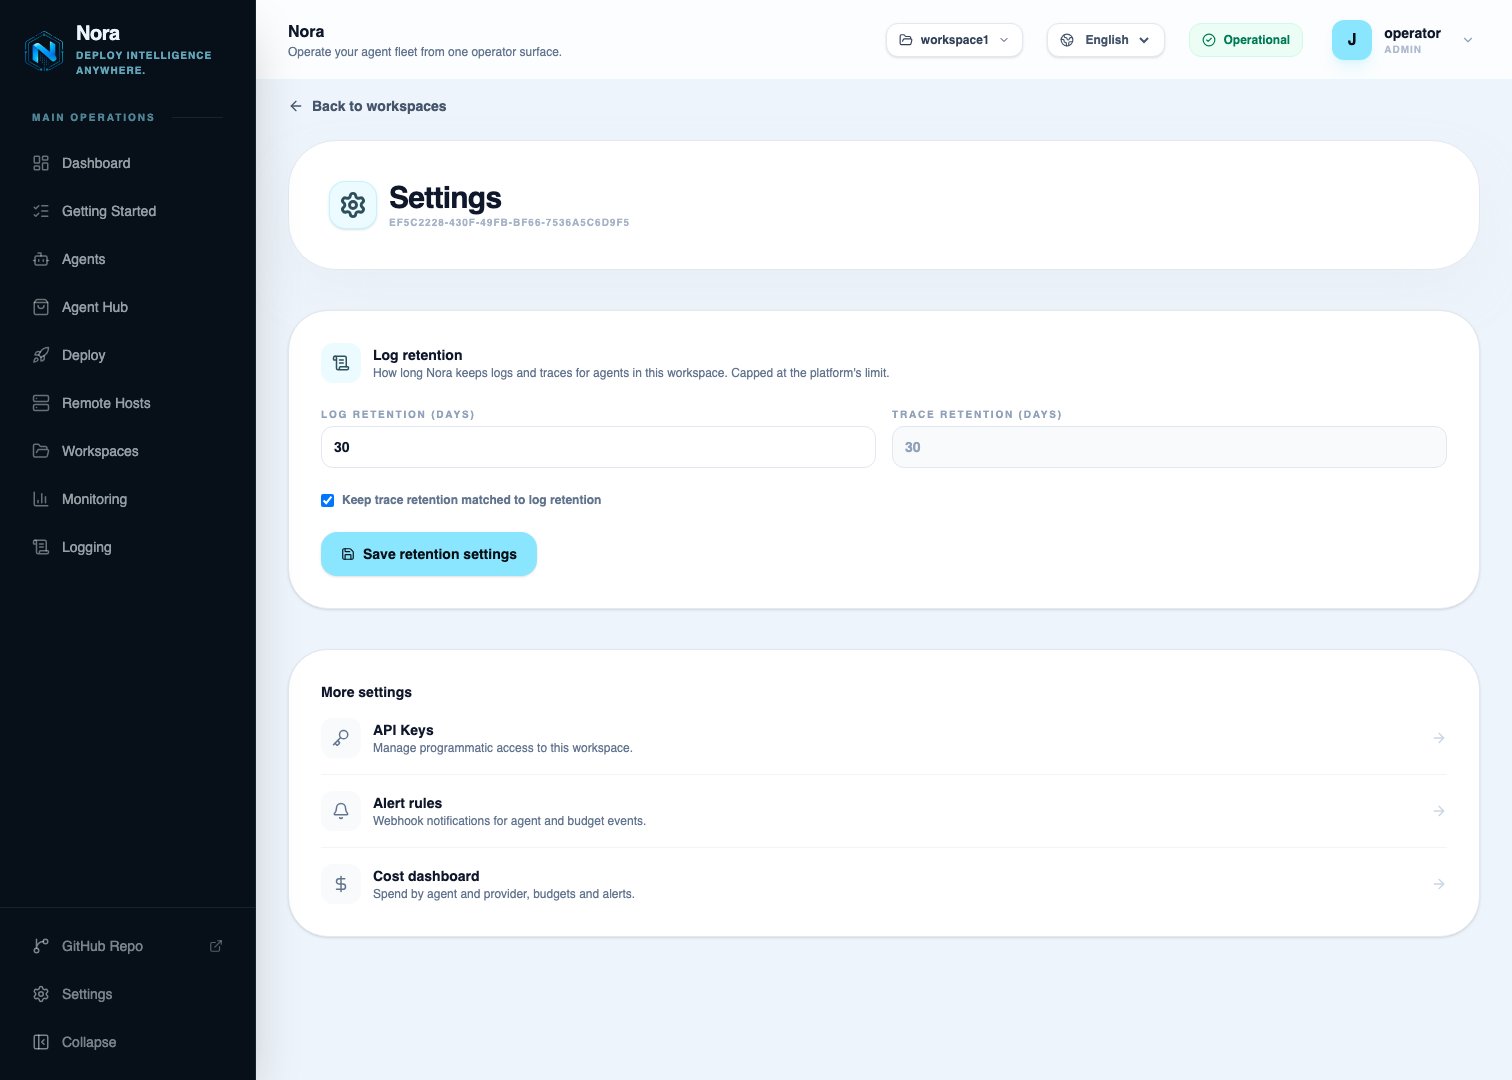
| Per-workspace log and trace retention | ceiling | The workspace's **Settings** page → **Log retention** |
A workspace can choose a **shorter** period than the platform ceiling, but never a longer one. In PaaS mode the ceiling comes from the subscription plan — see [Platform modes](/configuration/platform-modes).
Or through the API:
```http theme={null} theme={null}
PUT /api/admin/log-storage
{
"storageBackend": "s3",
"s3Bucket": "nora-logs-prod",
"s3Region": "us-east-1",
"s3AccessKeyId": "...",
"s3SecretAccessKey": "...",
"keepSourceCopies": true
}
```
New logs go to the new destination right away. When you switch to a different type of destination (for example `local` to `s3`), existing logs are copied over in the background — check progress with `GET /api/admin/log-storage/migration`. Only one migration can run at a time.
`keepSourceCopies` decides what happens to the old copies:
* **`false`** — old copies are deleted once they've been copied over.
* **`true`** — old copies are kept until they expire under normal retention. Keep the old destination's credentials configured until then.
## Retention
Logs and traces are deleted automatically once they're older than the retention period.
| Setting | Default | Where to change it |
| - | - | - |
| `NORA_LOG_RETENTION_CEILING_DAYS` | `30` | `.env`, then restart `backend-api` and `worker-provisioner` |
| Per-workspace log and trace retention | ceiling | The workspace's **Settings** page → **Log retention** |
A workspace can choose a **shorter** period than the platform ceiling, but never a longer one. In PaaS mode the ceiling comes from the subscription plan — see [Platform modes](/configuration/platform-modes).
 Shortening retention applies to existing logs too. Within about an hour, logs older than the new
period are deleted and can't be recovered.
### Disk limit for `local` storage
`NORA_LOG_LOCAL_MAX_BYTES` caps how much disk `local` logs can use across the whole installation, so logs don't fill the host's disk and take Nora down with it. Setup sets the cap to the smaller of 10 GB or 20% of free disk, leaving the rest of the disk for Nora itself.
The **Log Storage** card in admin settings shows current usage against the cap, with a status badge:
| Status | When | What happens |
| - | - | - |
| **Capacity ok** | Below 80% of the cap | Normal collection. |
| **Capacity warning** | 80% of the cap or more | Collection continues. An event is added to the activity log. |
| **Capacity halted** | The cap is reached | **Log collection pauses for every workspace.** Nora doesn't delete old logs to make room. |
Collection resumes automatically once you raise the cap or delete logs.
## Gateway logs and traces (OpenClaw)
### Gateway logs
For OpenClaw agents, Nora also collects structured logs from the agent's gateway. These appear alongside container logs in the **Runtime** view, under the **Gateway** stream. Nora redacts secrets from gateway logs before storing them.
### Traces
Traces show each model call and tool call an agent makes, with duration, token counts, and cost.
**Traces aren't available yet.** They rely on an OpenClaw plugin that needs OpenClaw 2026.9.3 or
later, and Nora currently deploys 2026.6.11. Turning tracing on today is safe but has no effect,
so leave it off until a Nora release moves to a supported OpenClaw version. No action needed;
please don't run `openclaw update` inside an agent to get there sooner, as it can break the agent.
Like log collection, tracing is a platform-wide setting: it's on or off for every OpenClaw agent, and there's no per-workspace switch. It's off by default. To turn it on, set `NORA_TRACES_ENABLED=true` in `.env` and restart `backend-api`.
Running agents pick up the change within about 30 seconds, without restarting. Nora installs the OpenClaw tracing plugin automatically and the **Traces** view shows whether it loaded for each agent.
Agents send traces to Nora, so they need to be able to reach it. For agents on Kubernetes, Remote Docker, or Proxmox, set `NORA_OTLP_PUBLIC_ENDPOINT` to an address of Nora those hosts can reach (for example `https://nora.example.com/api`).
Select a trace to see its span waterfall, with log lines from the same agent and time window shown underneath.
Prompt and tool-output content is never captured in traces, and every request is traced (no
sampling), so cost totals reflect real spend.
## Encryption key rotation
`NORA_LOG_ENCRYPTION_KEY` accepts multiple comma-separated `keyId:hexkey` pairs. The first one is used for new logs; the rest are kept for reading older logs.
Put the new pair first, for example `k2:,k1:`.
Restart `worker-provisioner` and `backend-api`.
When no logs encrypted with the old key remain (they've aged out under retention), remove the old pair.
## Search and export through the API
Search and export work on one agent at a time:
```http theme={null} theme={null}
GET /api/logs/search?agentId=&from=...&to=...&q=timeout&limit=200
GET /api/logs/export?agentId=&from=...&to=...&format=csv
```
Both accept the same filters as the dashboard (`streams`, `levels`, `q`). Export returns NDJSON (default) or CSV and requires a `from` / `to` range.
## Troubleshooting
Collection is off until someone turns it on — check **Settings → Log Collection** in the admin
dashboard (or `NORA_LOG_ENABLED=true` in `.env`). Then check that `NORA_LOG_ENCRYPTION_KEY` is
set and restart `worker-provisioner`.
On `local` storage, the disk cap (`NORA_LOG_LOCAL_MAX_BYTES`) has been reached — the Log Storage
card in admin settings shows **Capacity halted**. Raise the cap or delete logs; collection
resumes on its own within about 30 seconds.
`worker-provisioner` couldn't be reached, so the last few minutes of not-yet-stored logs are
missing. Stored logs are still returned. Check that the worker is running.
If the connection to an agent's gateway drops silently, Nora detects it and reconnects within
about a minute.
Tracing is off for the installation, which is the default. A platform admin turns it on with
`NORA_TRACES_ENABLED=true` — but see the next entry first.
Expected today: the OpenClaw version Nora deploys (2026.6.11) is older than the tracing plugin
requires (2026.9.3). There's no supported way to upgrade an agent's OpenClaw yet — don't run
`openclaw update` manually. Traces will work once Nora ships a supported version.
The live viewer on the agent page reads the container separately from the collector, so
formatting can differ slightly. The content is the same.
This documentation is built and hosted on [Mintlify](https://mintlify.com), a developer documentation platform.
Shortening retention applies to existing logs too. Within about an hour, logs older than the new
period are deleted and can't be recovered.
### Disk limit for `local` storage
`NORA_LOG_LOCAL_MAX_BYTES` caps how much disk `local` logs can use across the whole installation, so logs don't fill the host's disk and take Nora down with it. Setup sets the cap to the smaller of 10 GB or 20% of free disk, leaving the rest of the disk for Nora itself.
The **Log Storage** card in admin settings shows current usage against the cap, with a status badge:
| Status | When | What happens |
| - | - | - |
| **Capacity ok** | Below 80% of the cap | Normal collection. |
| **Capacity warning** | 80% of the cap or more | Collection continues. An event is added to the activity log. |
| **Capacity halted** | The cap is reached | **Log collection pauses for every workspace.** Nora doesn't delete old logs to make room. |
Collection resumes automatically once you raise the cap or delete logs.
## Gateway logs and traces (OpenClaw)
### Gateway logs
For OpenClaw agents, Nora also collects structured logs from the agent's gateway. These appear alongside container logs in the **Runtime** view, under the **Gateway** stream. Nora redacts secrets from gateway logs before storing them.
### Traces
Traces show each model call and tool call an agent makes, with duration, token counts, and cost.
**Traces aren't available yet.** They rely on an OpenClaw plugin that needs OpenClaw 2026.9.3 or
later, and Nora currently deploys 2026.6.11. Turning tracing on today is safe but has no effect,
so leave it off until a Nora release moves to a supported OpenClaw version. No action needed;
please don't run `openclaw update` inside an agent to get there sooner, as it can break the agent.
Like log collection, tracing is a platform-wide setting: it's on or off for every OpenClaw agent, and there's no per-workspace switch. It's off by default. To turn it on, set `NORA_TRACES_ENABLED=true` in `.env` and restart `backend-api`.
Running agents pick up the change within about 30 seconds, without restarting. Nora installs the OpenClaw tracing plugin automatically and the **Traces** view shows whether it loaded for each agent.
Agents send traces to Nora, so they need to be able to reach it. For agents on Kubernetes, Remote Docker, or Proxmox, set `NORA_OTLP_PUBLIC_ENDPOINT` to an address of Nora those hosts can reach (for example `https://nora.example.com/api`).
Select a trace to see its span waterfall, with log lines from the same agent and time window shown underneath.
Prompt and tool-output content is never captured in traces, and every request is traced (no
sampling), so cost totals reflect real spend.
## Encryption key rotation
`NORA_LOG_ENCRYPTION_KEY` accepts multiple comma-separated `keyId:hexkey` pairs. The first one is used for new logs; the rest are kept for reading older logs.
Put the new pair first, for example `k2:,k1:`.
Restart `worker-provisioner` and `backend-api`.
When no logs encrypted with the old key remain (they've aged out under retention), remove the old pair.
## Search and export through the API
Search and export work on one agent at a time:
```http theme={null} theme={null}
GET /api/logs/search?agentId=&from=...&to=...&q=timeout&limit=200
GET /api/logs/export?agentId=&from=...&to=...&format=csv
```
Both accept the same filters as the dashboard (`streams`, `levels`, `q`). Export returns NDJSON (default) or CSV and requires a `from` / `to` range.
## Troubleshooting
Collection is off until someone turns it on — check **Settings → Log Collection** in the admin
dashboard (or `NORA_LOG_ENABLED=true` in `.env`). Then check that `NORA_LOG_ENCRYPTION_KEY` is
set and restart `worker-provisioner`.
On `local` storage, the disk cap (`NORA_LOG_LOCAL_MAX_BYTES`) has been reached — the Log Storage
card in admin settings shows **Capacity halted**. Raise the cap or delete logs; collection
resumes on its own within about 30 seconds.
`worker-provisioner` couldn't be reached, so the last few minutes of not-yet-stored logs are
missing. Stored logs are still returned. Check that the worker is running.
If the connection to an agent's gateway drops silently, Nora detects it and reconnects within
about a minute.
Tracing is off for the installation, which is the default. A platform admin turns it on with
`NORA_TRACES_ENABLED=true` — but see the next entry first.
Expected today: the OpenClaw version Nora deploys (2026.6.11) is older than the tracing plugin
requires (2026.9.3). There's no supported way to upgrade an agent's OpenClaw yet — don't run
`openclaw update` manually. Traces will work once Nora ships a supported version.
The live viewer on the agent page reads the container separately from the collector, so
formatting can differ slightly. The content is the same.
This documentation is built and hosted on [Mintlify](https://mintlify.com), a developer documentation platform.